At the moment the software only runs on Windows platform. I used Visual Basic 2013 Express to develop the software. The details of this project, including the sourcecodes and the binary file (*.exe) can be found here. The description below is a quick introduction of the main interface. There is also a short introductory video to show the software in action at the end of this post.
Figure 1 - Main window.

Figure 2 - Smith Chart window
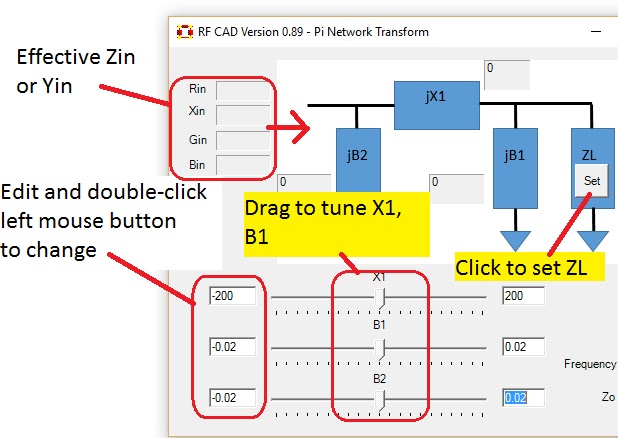
Figure 3 - Pi impedance transformation network window
The Smith Chart window allows the user to plot an impedance (Z) or admittance (Y) or reflection coefficient (Rho) on the chart (the upper left hand corner). User can toggle the impedance and admittance coordinate on the Smith Chart, can change the color and trace thickness (by double-clicking on the Smith Chart region), and even zoom in and out of the Smith Chart (using the wheel on the mouse). Furthermore the plotting region is not confined to the standard Smith Chart, you can also plot a Z or Y with negative resistance or conductance. There is also a dynamic readout of the Z, Y and Rho parameters corresponding to the tip of the mouse cursor. As you move the mouse cursor on the Smith Chart window, the instantaneous Z, Y and Rho values will be shown on the left hand panel of the window. Finally there are other useful extra functions, try right clicking on the mouse in the Smith Chart region to call up the Context Menu.

Here are two videos showing the usage of the software:
1. Introducing the fSMITH software and features:
2. Design L-lumped impedance matching network example.